Competitive analysis is an essential part of the job description for most marketers. It would be best to thoroughly understand your competitors’ strategies to develop an impactful marketing strategy. That’s where a competitive analysis framework comes in. This article uses visuals to explain five popular competitive analysis frameworks and discusses what each is best suited for.
What Is a Competitive Analysis Framework?
A competitive analysis framework is a model you can use to help shape how you go about researching your competitors. It helps you home in on specific information by giving a structure to guide your market analysis.
There are several frameworks you can use for competitive analysis in marketing. But how do you choose the right one for your needs? If you’re a digital marketing agency aiming to get a sense of a new client’s competitors, your needs may differ from an in-house marketing director.
Here, we explain five of the most popular competitive analysis frameworks with visuals and discuss what each is best suited for.
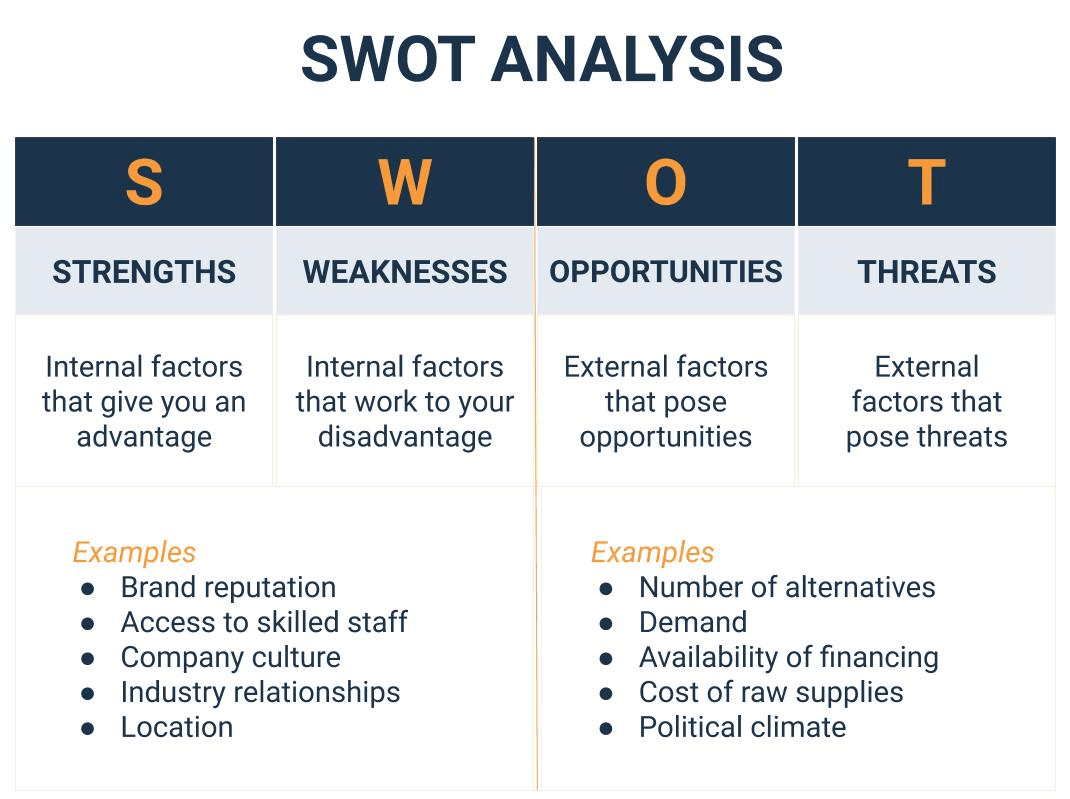
1. SWOT Analysis
The SWOT framework helps you evaluate the internal (Strengths and Weaknesses) and external factors (Opportunities and Threats) that impact your business or a course of action.
When to Use a SWOT Analysis
SWOT analysis is often used in strategic planning to help identify a potential competitive advantage.
For example, your strong relationships with suppliers might allow you to offer lower prices than your competitors. But you can also apply it in much narrower situations. You can use it to evaluate a decision by looking at your strengths, weaknesses, opportunities, and threats relative to the decision, for example.
Marketing agencies often perform a marketing SWOT analysis as part of their clients’ competitive landscape analysis (CLA). They may compare strengths and weaknesses across competitors for various marketing channels, such as websites, blogs, social media, digital ads, and organic search. This helps them determine recommendations for a client’s strategy.
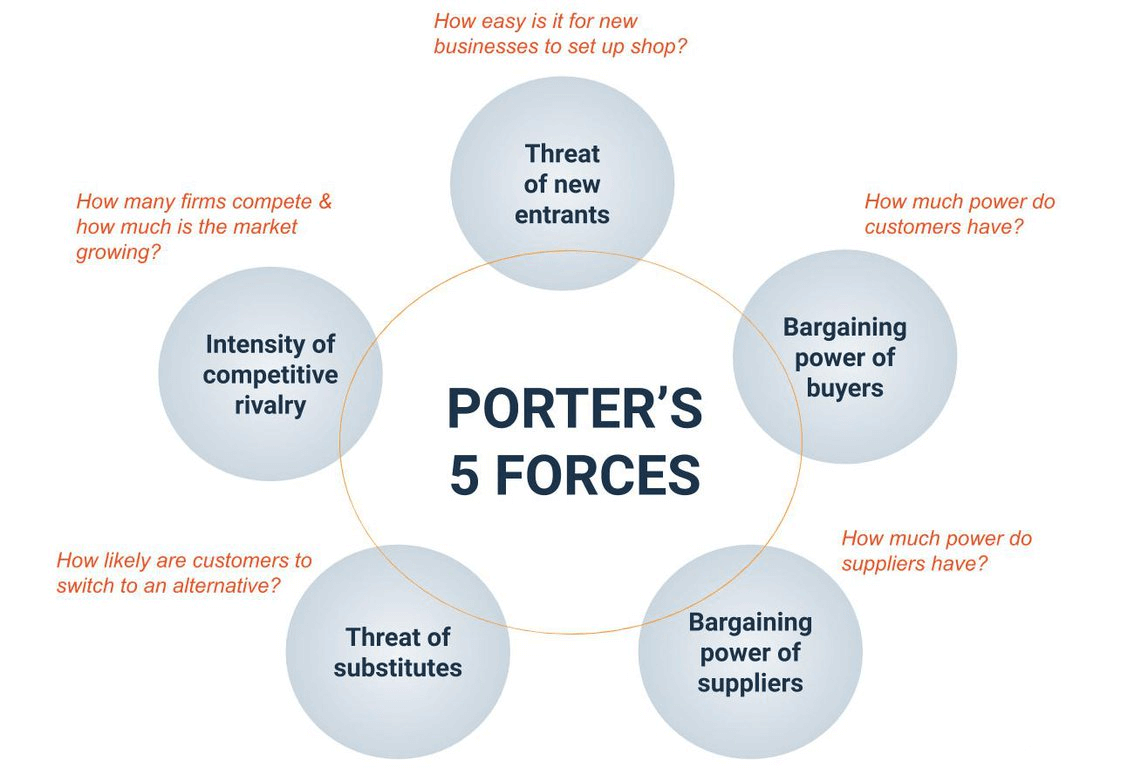
2. Porter’s Five Forces
Porter’s Five Forces is a framework that examines the competitive market forces in an industry or segment. It helps you evaluate an industry or market according to five elements: new entrants, buyers, suppliers, substitutes, and competitive rivalry.
According to Michael Porter’s model, these are the fundamental forces that directly affect how much competition a business faces in an industry.
When to Use Porter’s Five Forces
This framework is practical when you want to analyze the competitive structure of an industry. For example, the five forces can provide insights into how attractive it is to enter a new market. This is helpful if you are considering whether you should expand your product offering to reach new customers.
Competitor analysis using Porter’s Five Forces can also provide insights to help you shape your strategy for the competitive landscape of your industry. For instance, if the threat of substitutes is high, you may seek to mitigate that competitive force with a strategy focused on building brand affinity among your customers.
3. Strategic Group Analysis
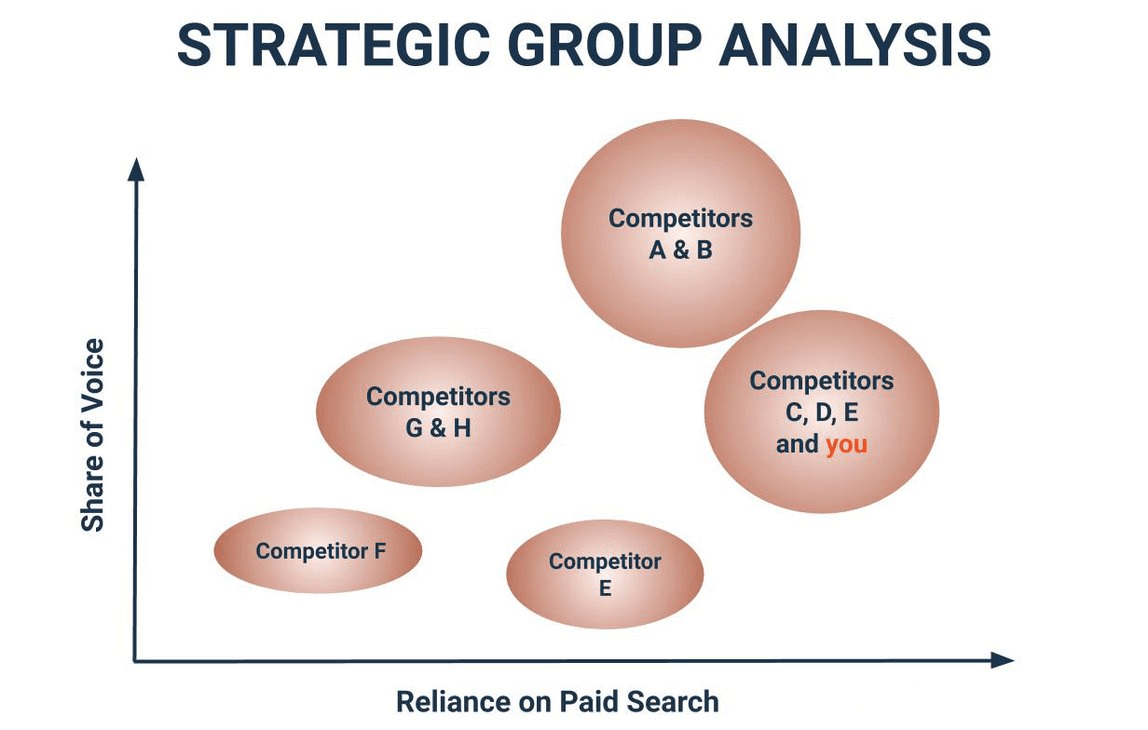
Strategic Group Analysis is a competitive analysis framework that lets you analyze organizations in clusters based on the similarity of strategy. By identifying the set your firm falls into for any given strategic dimension, you can get a sense of the impact of the different strategic approaches. You can also see those you are most closely competing with.
When to Use Strategic Group Analysis
This framework is handy when you have a hypothesis about the effect of a business dimension. For example, you can create strategic groups according to digital marketing tactics and analyze the performance of the groups to explore potential causality.
How do competitors who rely heavily on paid search campaigns fare when it comes to sharing of voice? Which competitors fall into the same cluster as your firm regarding their pricing strategy?
By exploring different dimensions, you can surface critical factors for success and evaluate your position relative to others in the industry.
4. Growth-Share Matrix
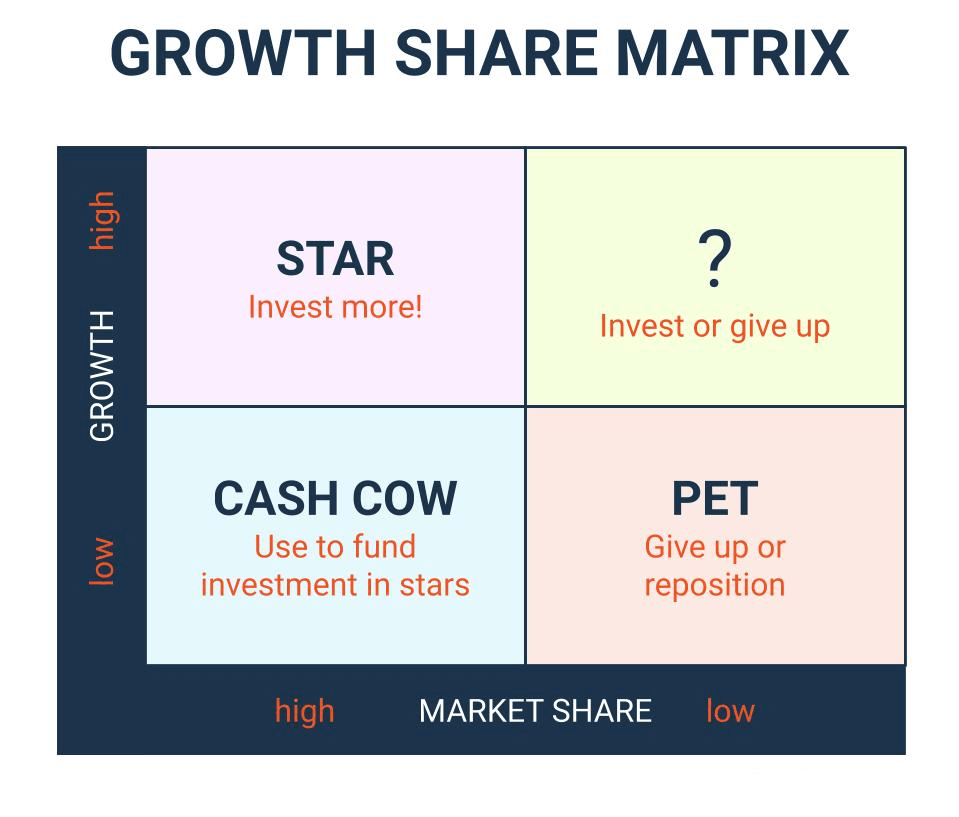
The Growth-Share Matrix is an analysis framework that classifies the products in your company’s portfolio against the competitive landscape of your industry. Developed by the Boston Consulting Group (BCG) founder in 1970, the model gained widespread acceptance for helping companies decide which products to invest in based on competitiveness and market attractiveness.
The Growth-Share Matrix is an analysis framework that classifies the products in your company's portfolio against the competitive landscape of your industry.Click to tweetAccording to BCG, products fall into one of four quadrants in the matrix, each with a corresponding strategy:
- Question marks are high-growth but low-market-share products, often new products with high potential. These should be invested in or let go, depending on how likely a product is to become a star.
- Stars are products that are likely to achieve high growth and high market share. Your firm should invest heavily in these products.
- Cash cows are low-growth but high-share products. These products bring in cash and can fund investment in your stars.
- Pets are low-share, low-growth products considered failures. Your business should reposition these products or stop investing in them.
When to Use the Growth-Share Matrix
The traditional use of this competitive analysis framework is to help large firms determine their product portfolios — which products to invest in further and which to cut, based on expected cash flow produced.
However, it holds other uses, too. Smart Insights notes that this model can also be applied to analyzing digital marketing strategies. By plotting channel growth against the ROI of the channel and evaluating similar to how you would determine products, a marketer can see which channels to invest in or stop using, for example.
5. Perceptual Mapping
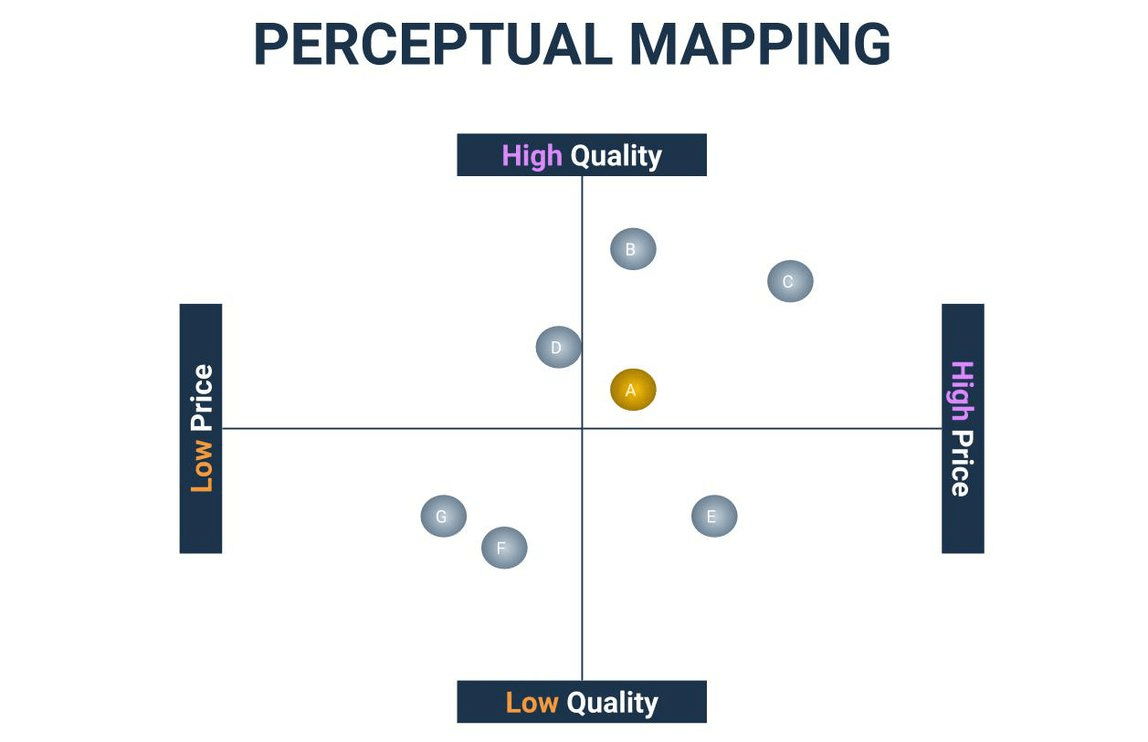
Perceptual mapping is a visual representation of perceptions of your product relative to competing alternatives. It’s also called positioning mapping because it shows the position of your brand, product, or service mapped against your competitors.
The first step is to determine two attributes you’ll use as the basis for comparison. Next, you plot where your product and those of your competitors fall on the spectrum of those two attributes.
Here we can see a competitor analysis framework example that maps perceptions of quality against price:
When to Use Perceptual Mapping
Perceptual mapping helps understand how your customers perceive your product offering in relation to your competitors. Market researchers use perceptual mapping to show the results of customer input they have collected.
As a marketer, mapping helps understand how customers view you and your competitors. This will help you know whether your existing positioning strategy is registering with your target audience. It can also provide insight into gaps to target.
Finding the Right Competitive Analysis Framework is Just the First Step
Once you identify the competitive analysis framework that fits your situation, you’ll need to start researching. We offer valuable tools and guides to help you gather data and analyze your competitors’ online presence.
Firstly published on: blog.alexa.com.
Here are a few of our best guides: